The following figure shows the demand and supply curves for a good. The initial demand curve is D₁ and the supply curve is S. Later, due to an external shock, the demand curve shifts to D₂.
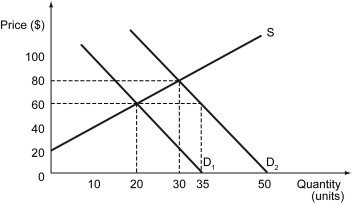
-Refer to the figure above.What is the equilibrium price after the demand curve shifts to D₂?
A) $20
B) $40
C) $60
D) $80
Correct Answer:
Verified
Q173: The following figure shows the demand and
Q174: If prices are held below the equilibrium
Q175: The following figure shows the demand and
Q176: Which of the following is likely to
Q177: If prices are held above the equilibrium
Q179: Scenario: Keeping beef prices low makes the
Q180: Which of the following statements is true?
A)
Q181: The following figure depicts the market for
Q182: After the imposition of the price controls,
Q183: The following figure illustrates the demand and
Unlock this Answer For Free Now!
View this answer and more for free by performing one of the following actions

Scan the QR code to install the App and get 2 free unlocks

Unlock quizzes for free by uploading documents