The following figure illustrates the demand and supply curves for a good in a competitive market.
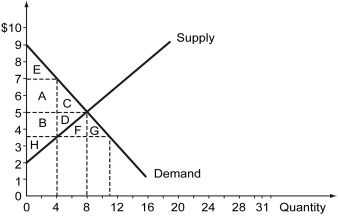
-Refer to the figure above.Suppose a price control of $3.50 is imposed on this market.What would be a consequence of this price control policy?
A) A surplus of 4 units
B) A shortage of 8 units
C) A shortage of 4 units
D) A shortage of 7 units.
Correct Answer:
Verified
Q178: The following figure shows the demand and
Q179: Scenario: Keeping beef prices low makes the
Q180: Which of the following statements is true?
A)
Q181: The following figure depicts the market for
Q182: After the imposition of the price controls,
Q184: The decrease in social surplus from a
Q185: The following figure illustrates the demand and
Q186: Scenario: The figure on the left shows
Q187: The following figure depicts the market for
Q188: What is the economic variable that guides
Unlock this Answer For Free Now!
View this answer and more for free by performing one of the following actions

Scan the QR code to install the App and get 2 free unlocks

Unlock quizzes for free by uploading documents