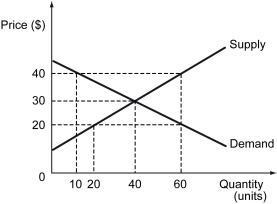
The following figure illustrates the demand and supply curves in the market for watches.Calculate the shortage or surplus in the market when the price is first held at $20 and then at $40.
Correct Answer:
Verified
View Answer
Unlock this answer now
Get Access to more Verified Answers free of charge
Q180: Which of the following statements is true?
A)
Q181: The following figure depicts the market for
Q182: After the imposition of the price controls,
Q183: The following figure illustrates the demand and
Q184: The decrease in social surplus from a
Q186: Scenario: The figure on the left shows
Q187: The following figure depicts the market for
Q188: What is the economic variable that guides
Q189: After the imposition of the price controls,
Q190: What are price controls? How do they
Unlock this Answer For Free Now!
View this answer and more for free by performing one of the following actions

Scan the QR code to install the App and get 2 free unlocks

Unlock quizzes for free by uploading documents