The following figure shows the demand and supply curves for bottled water.
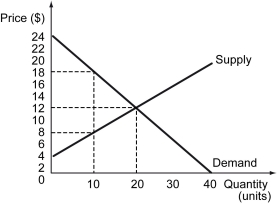
-Refer to the figure above.What is the equilibrium quantity of bottled water?
A) 10 units
B) 20 units
C) 30 units
D) 40 units
Correct Answer:
Verified
Q204: The following figure shows the demand and
Q205: Which of the following statements is true?
A)
Q206: The problem of bringing economic agents together
Q207: _ is the market value of final
Q208: The following figure shows the demand and
Q210: The following figure shows the demand and
Q211: The following figure shows the demand and
Q212: The following figure shows the supply and
Q213: The following figure shows the supply and
Q214: The following figure depicts the market for
Unlock this Answer For Free Now!
View this answer and more for free by performing one of the following actions

Scan the QR code to install the App and get 2 free unlocks

Unlock quizzes for free by uploading documents