The following figure shows the supply and demand for Uber rides in downtown Miami. On New Year's Eve the demand for Uber rides in downtown increases significantly.
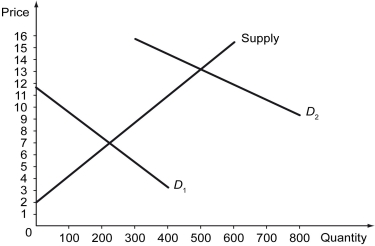
-Refer to the figure above.Which statement is true?
A) The line D₁ represents the demand on ordinary days, and the the line D₂ represents demand on New Year's Eve.
B) The Uber fare on New Year's Eve is kept lower than its equilibrium amount.
C) There will be a shortage of Uber rides in downtown Miami if this market is left unregulated.
D) There will be a surplus of Uber rides in downtown Miami on New Year's Eve.
Correct Answer:
Verified
Q207: _ is the market value of final
Q208: The following figure shows the demand and
Q209: The following figure shows the demand and
Q210: The following figure shows the demand and
Q211: The following figure shows the demand and
Q213: The following figure shows the supply and
Q214: The following figure depicts the market for
Q215: The following figure shows the demand and
Q216: D.Gale Johnson was an economist at Iowa
Q217: Which of the following best describes a
Unlock this Answer For Free Now!
View this answer and more for free by performing one of the following actions

Scan the QR code to install the App and get 2 free unlocks

Unlock quizzes for free by uploading documents