The following figure shows the production possibilities curve for a software engineer who has to divide her available time between producing computer programs and Web sites.
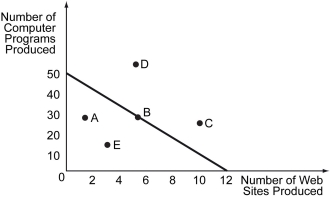
-Refer to the figure above.If the engineer spends her entire time producing computer programs,how many computer programs can she produce?
A) 12
B) 30
C) 45
D) 50
Correct Answer:
Verified
Q2: Scenario: Yasmin and Zeek are lawyers working
Q3: Which of the following best describes a
Q4: Scenario: Yasmin and Zeek are lawyers working
Q5: A curve that shows the various combinations
Q6: The following figure shows the production possibilities
Q7: Scenario: Yasmin and Zeek are lawyers working
Q8: Scenario: Jack takes 3 hours to complete
Q9: The underlying motivation for trade,relies on one
Q10: The following figure shows the production possibilities
Q11: A machine can manufacture 1 unit of
Unlock this Answer For Free Now!
View this answer and more for free by performing one of the following actions

Scan the QR code to install the App and get 2 free unlocks

Unlock quizzes for free by uploading documents