The figure below shows the production possibilities curves (PPCs) for Viola and Davis.Which of the lines in the graph correctly represents their joint PPC?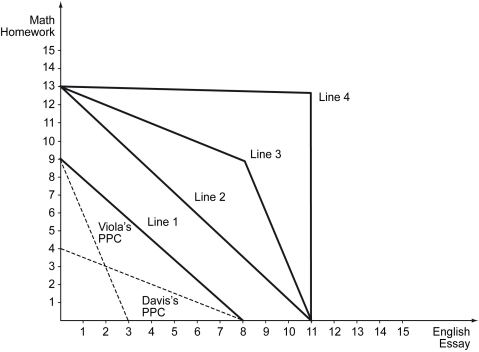
A) Line 1
B) Line 2
C) Line 3
D) Line 4
Correct Answer:
Verified
Q75: The following figure shows the production possibilities
Q76: Which of the following statements is true?
A)
Q77: The following figure depicts the production possibilities
Q78: The following figure shows the production possibilities
Q79: Which of the following statements is true?
A)
Q81: The figure below shows production possibilities curves
Q82: The figure below shows the potential gains
Q83: Two countries,A and B,produce Good X.Which of
Q84: Which of the following statements is true?
A)
Q85: The production possibilities schedules and curves for
Unlock this Answer For Free Now!
View this answer and more for free by performing one of the following actions

Scan the QR code to install the App and get 2 free unlocks

Unlock quizzes for free by uploading documents