The following figure shows the production possibilities curves (PPCs) of two individuals, Ryan and Tom.
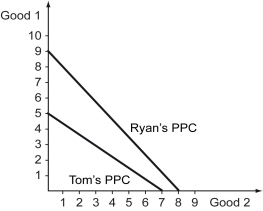
-Refer to the figure above.Which of the following statements is true?
A) Ryan has an absolute advantage in the production of Good 1, whereas Tom has an absolute advantage in the production of Good 2.
B) Tom has an absolute advantage in the production of Good 1, whereas Ryan has an absolute advantage in the production of Good 2.
C) Ryan has an absolute advantage in the production of both goods.
D) Tom has an absolute advantage in the production of both goods.
Correct Answer:
Verified
Q70: Which of the following statements is true?
A)
Q71: The following figure depicts the production possibilities
Q72: Scenario: Meryl and Steve are two classmates
Q73: Specialization occurs when each individual,firm,or country _.
A)
Q74: The following figure shows the production possibilities
Q76: Which of the following statements is true?
A)
Q77: The following figure depicts the production possibilities
Q78: The following figure shows the production possibilities
Q79: Which of the following statements is true?
A)
Q80: The figure below shows the production possibilities
Unlock this Answer For Free Now!
View this answer and more for free by performing one of the following actions

Scan the QR code to install the App and get 2 free unlocks

Unlock quizzes for free by uploading documents