The figure below shows production possibilities curves for tomatoes and oranges in two prefectures in a country.
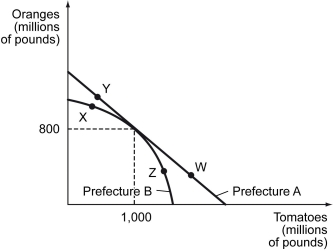
-Refer to the figure above.In Prefecture A,the opportunity cost of producing each additional pound of tomatoes ________.
A) increases as more tomatoes are produced
B) stays the same as more tomatoes are produced
C) decreases as more tomatoes are produced
D) increases up to 1 billion (1,000 million) pounds and then decreases after 1 billion pounds
Correct Answer:
Verified
Q84: Which of the following statements is true?
A)
Q85: The production possibilities schedules and curves for
Q86: The following figure illustrates the production possibilities
Q87: The figure below shows production possibilities curves
Q88: Which of the following statements is true?
A)
Q90: Scenario: Norway and Sweden each produce cloudberries
Q91: Suppose Country A produces 10 chairs and
Q92: The figure below shows production possibilities curves
Q93: Which of the following statements is true
Q94: Terms of trade refers to the _.
A)
Unlock this Answer For Free Now!
View this answer and more for free by performing one of the following actions

Scan the QR code to install the App and get 2 free unlocks

Unlock quizzes for free by uploading documents