The figure below shows production possibilities curves for tomatoes and oranges in two prefectures in a country.
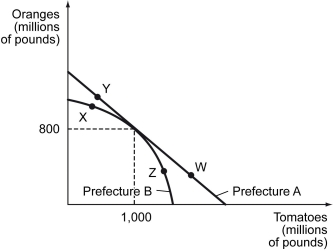
-Refer to the figure above.Which statement is true?
A) Prefecture A has a comparative advantage in tomato production.
B) Prefecture B has a comparative advantage in tomato production.
C) Prefecture A has a comparative advantage in tomato production up to 1 billion pounds, but Prefecture B has a comparative advantage beyond 1 billion pounds.
D) Prefecture B has a comparative advantage in tomato production up to 1 billion pounds, but Prefecture A has a comparative advantage beyond 1 billion pounds.
Correct Answer:
Verified
Q87: The figure below shows production possibilities curves
Q88: Which of the following statements is true?
A)
Q89: The figure below shows production possibilities curves
Q90: Scenario: Norway and Sweden each produce cloudberries
Q91: Suppose Country A produces 10 chairs and
Q93: Which of the following statements is true
Q94: Terms of trade refers to the _.
A)
Q95: Scenario: Norway and Sweden each produce cloudberries
Q96: Scenario: Norway and Sweden each produce cloudberries
Q97: What is meant by the term "comparative
Unlock this Answer For Free Now!
View this answer and more for free by performing one of the following actions

Scan the QR code to install the App and get 2 free unlocks

Unlock quizzes for free by uploading documents