The figure below shows production possibilities curves for tomatoes and oranges in two prefectures in a country.
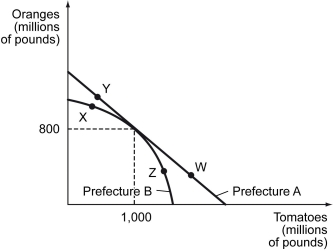
-Refer to the figure above. Suppose that Prefecture A produces at point Y, while Prefecture B produces at point Z. Could there be gains from trade (Prefecture A sells oranges to Prefecture B, and Prefecture B sells tomatoes to Prefecture B) ? Why or why not?
A) Yes, because Prefecture A has a comparative advantage in orange production up to 800 million pounds while Prefecture B has a comparative advantage in tomato production beyond 1 billion pounds.
B) Yes, because Prefecture A produces more oranges while Prefecture B produces more tomatoes.
C) No, because Prefecture A's opportunity cost of producing additional pound of tomatoes at W is higher than Prefecture B's opportunity cost at X.
D) No, because Prefecture A's opportunity cost of producing additional pound of oranges at W is higher than Prefecture B's opportunity cost at X.
Correct Answer:
Verified
Q105: The curvature of an economy's production possibilities
Q106: Which of the following is not a
Q107: Which of the following statements is true?
A)
Q108: An export is any good that is
Q109: A production possibilities curve is plotted for
Q111: The following figure represents various production possibilities
Q112: Which of the following represents a good
Q113: Iowa produces a small amount of wool
Q114: Which of the following statements is true
Q115: An economy produces apples and oranges.The dashed
Unlock this Answer For Free Now!
View this answer and more for free by performing one of the following actions

Scan the QR code to install the App and get 2 free unlocks

Unlock quizzes for free by uploading documents