The following figure represents various production possibilities curves (PPCs) of economies that produce apples and oranges.
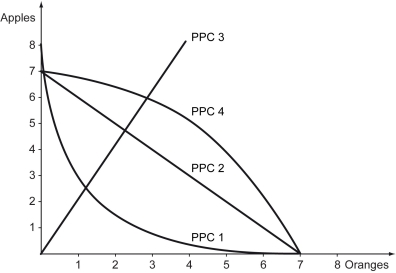
-Refer to the figure above.An economy produces apples and oranges.In this economy,the opportunity cost of producing apples and the opportunity cost of producing oranges are both increasing.In the figure,which curve correctly represents the production possibilities frontier of this economy?
A) PPC 1
B) PPC 2
C) PPC 3
D) PPC 4
Correct Answer:
Verified
Q106: Which of the following is not a
Q107: Which of the following statements is true?
A)
Q108: An export is any good that is
Q109: A production possibilities curve is plotted for
Q110: The figure below shows production possibilities curves
Q112: Which of the following represents a good
Q113: Iowa produces a small amount of wool
Q114: Which of the following statements is true
Q115: An economy produces apples and oranges.The dashed
Q116: The following figure represents various production possibilities
Unlock this Answer For Free Now!
View this answer and more for free by performing one of the following actions

Scan the QR code to install the App and get 2 free unlocks

Unlock quizzes for free by uploading documents