The following figure shows the private cost and social cost of producing Good X.
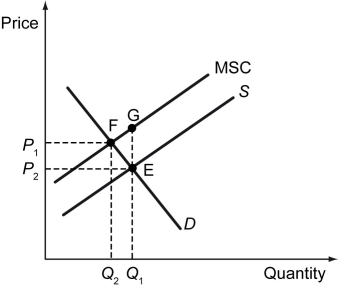
-Refer to the figure above.Which of the following statements is true in this case?
A) P₁ is the socially optimal price for Good X.
B) P₂ is the price of Good X in a free market.
C) Q₂ units is the efficient level of output of Good X.
D) Q₂ units is the quantity supplied of Good X in a free market.
Correct Answer:
Verified
Q2: The social cost of producing a good
Q3: Scenario: In Brazil, more than 60 percent
Q4: Deadweight loss refers to the loss in
Q5: In a market,social surplus is maximized when
Q6: If the production of a good involves
Q7: When the production of a good generates
Q8: Externalities essentially create _.
A) non-excludability in consumption
B)
Q9: Which of the following is not true
Q10: Which of the following is the best
Q11: The following figure shows the private cost
Unlock this Answer For Free Now!
View this answer and more for free by performing one of the following actions

Scan the QR code to install the App and get 2 free unlocks

Unlock quizzes for free by uploading documents