The following figure depicts the market for a certain good and the incidence of a tax on consumers.
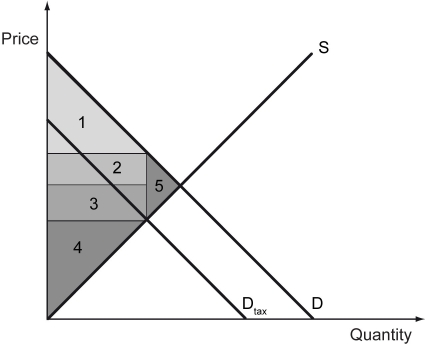
-Refer to the figure above.The after-tax social surplus is ________.
A) Regions 1 and 4
B) Regions 2 and 3
C) Regions 1,2, 3, and 4
D) Regions 1, 2, 3, 4, and 5
Correct Answer:
Verified
Q119: The figure below shows the demand and
Q120: The figure below shows the demand (D)
Q121: The burden of a tax falls more
Q122: Which of the following is true?
A) A
Q123: Why are lump-sum taxes regressive in nature?
Q125: A lump-sum tax is a(n)_.
A) progressive tax
B)
Q126: Which of the following taxes does NOT
Q127: The tax incidence on sellers is higher
Q128: A binding price ceiling will result in
Q129: Blue laws (bans on stores being open
Unlock this Answer For Free Now!
View this answer and more for free by performing one of the following actions

Scan the QR code to install the App and get 2 free unlocks

Unlock quizzes for free by uploading documents