The figure below shows the demand curve in a monopoly market.
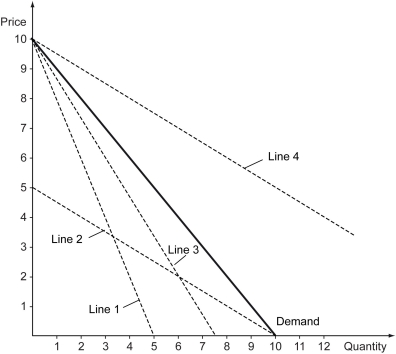
-Refer to the figure above.Which of the four dashed lines represent the marginal revenue of this monopoly firm?
A) Line 1
B) Line 2
C) Line 3
D) Line 4
Correct Answer:
Verified
Q95: The figure below shows the demand curve
Q96: The following table shows the quantities of
Q97: The quantity effect of a price reduction
Q98: The following table shows the quantities of
Q99: For a firm with market power,the price
Q101: The following figure shows the demand curve
Q102: Which of the following characterizes the relation
Q103: The following figure shows the demand curve
Q104: The following figure shows the demand curve
Q105: The following figure shows the demand curve
Unlock this Answer For Free Now!
View this answer and more for free by performing one of the following actions

Scan the QR code to install the App and get 2 free unlocks

Unlock quizzes for free by uploading documents