The following figure shows the demand curve faced by a monopolist.
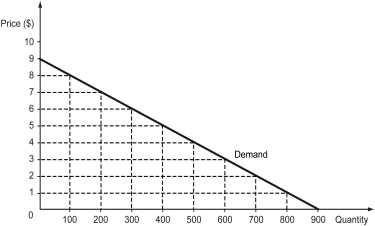
a)Calculate the quantity effect and price effect of a price cut from $6 to $5.Estimate the change in total revenue due to the price cut.
b)Comment on the elasticity of the demand curve between the price range $5 to $6.
Correct Answer:
Verified
View Answer
Unlock this answer now
Get Access to more Verified Answers free of charge
Q100: The figure below shows the demand curve
Q101: The following figure shows the demand curve
Q102: Which of the following characterizes the relation
Q103: The following figure shows the demand curve
Q104: The following figure shows the demand curve
Q106: The following figure shows the demand curve
Q107: Which of the following is true of
Q108: Differentiate between the quantity effect and price
Q109: Scenario: When a monopolist charges $10 for
Q110: Scenario: When a monopolist charges $5 for
Unlock this Answer For Free Now!
View this answer and more for free by performing one of the following actions

Scan the QR code to install the App and get 2 free unlocks

Unlock quizzes for free by uploading documents