The following figure shows the marginal revenue (MR) , marginal cost (MC) , and demand (D) curves for a firm operating as a monopoly.
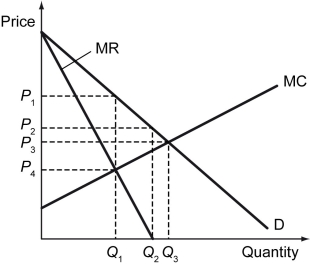
-Refer to the figure above.Compared to the competitive market outcome,when the monopolists sets its price to the optimal price,by how much is the quantity traded diminished?
A) By Q₁
B) By Q₃
C) By Q₃ Q₁
D) By Q₁ Q₂
Correct Answer:
Verified
Q173: A monopolist faces an average total cost
Q174: For a profit-maximizing monopolist,profits are given by
Q175: The following figure shows the marginal revenue
Q176: The figure below shows the cost and
Q177: The following figure shows the marginal revenue
Q179: The following figure represents the cost and
Q180: Which of the following statements correctly differentiates
Q181: Which of the following statements is true
Q183: The following figure shows the graph of
Q196: The figure below shows the cost and
Unlock this Answer For Free Now!
View this answer and more for free by performing one of the following actions

Scan the QR code to install the App and get 2 free unlocks

Unlock quizzes for free by uploading documents