The following figure represents the cost and revenue curves of a firm that is producing a service in a monopoly market.
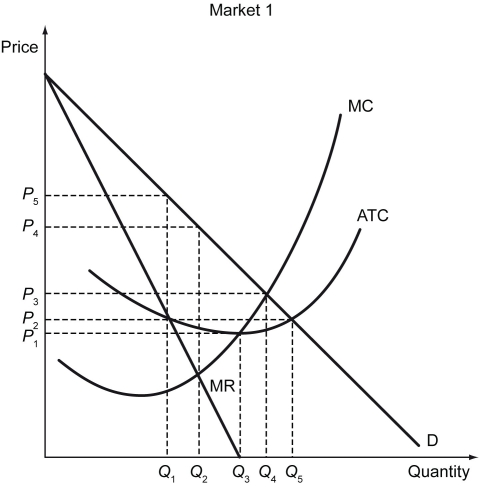
-Refer to the figure above.What is the optimal quantity that the monopolist should produce?
A) Q₁
B) Q₂
C) Q₄
D) Q₅
Correct Answer:
Verified
Q174: For a profit-maximizing monopolist,profits are given by
Q175: The following figure shows the marginal revenue
Q176: The figure below shows the cost and
Q177: The following figure shows the marginal revenue
Q178: The following figure shows the marginal revenue
Q180: Which of the following statements correctly differentiates
Q181: Which of the following statements is true
Q183: The following figure shows the graph of
Q184: The supply curve for a monopolist is
Q196: The figure below shows the cost and
Unlock this Answer For Free Now!
View this answer and more for free by performing one of the following actions

Scan the QR code to install the App and get 2 free unlocks

Unlock quizzes for free by uploading documents