The following figure shows the market demand curve for penicillin, an antibiotic medicine. Initially, the market was supplied by perfectly competitive firms. Later, the government granted the exclusive right to produce and sell penicillin to one firm. The figure also shows the marginal revenue curve (MR) of the firm once it begins to operate as a monopoly. The marginal cost is constant at $3, irrespective of the market structure.
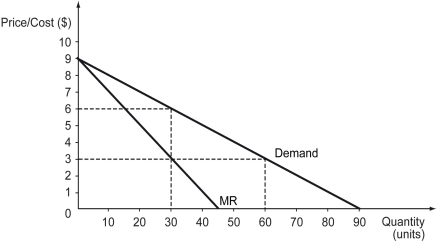
-Refer to the figure above.What is the quantity supplied in the market when the market is perfectly competitive?
A) 30 units
B) 45 units
C) 60 units
D) 90 units
Correct Answer:
Verified
Q201: The following figure shows the market demand
Q202: The following figure shows the market demand
Q203: The following figure shows the market demand
Q204: The following figure shows the market demand
Q205: The following figure is a supply-demand diagram
Q207: The following figure is a supply-demand diagram
Q208: The following figure shows the market demand
Q209: The following figure shows the demand (D),
Q210: The following figure is a supply-demand diagram
Q211: The following figure shows the market demand
Unlock this Answer For Free Now!
View this answer and more for free by performing one of the following actions

Scan the QR code to install the App and get 2 free unlocks

Unlock quizzes for free by uploading documents