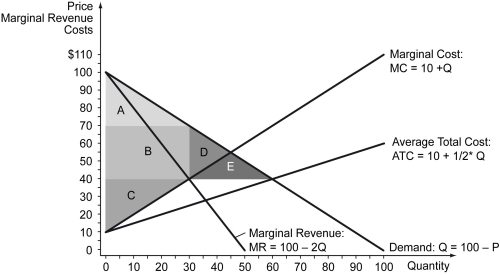
The following figure is a supply-demand diagram that characterizes the demand, marginal revenue, and cost curves for a profit-maximizing monopolist.
-The following figure shows the demand curve for Good X in a perfectly competitive market.Later,the government grants one of the firms the exclusive right to manufacture and sell Good X.MR represents the marginal revenue curve of the firm when it operates as a monopoly.The marginal cost of producing Good X is constant at $5.
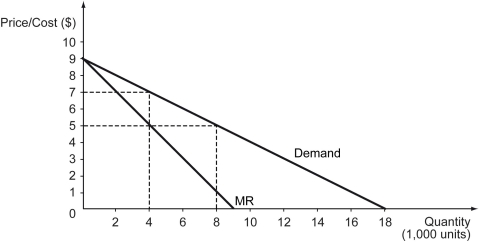
a)What is the quantity supplied when the market is perfectly competitive? What happens to the quantity supplied once the market changes to a monopoly?
b)What is the market price when the market is perfectly competitive? What is the market price when the market changes to a monopoly?
c)Compare the consumer surplus when the market is perfectly competitive and the consumer surplus when the market is a monopoly.Is there any producer surplus or deadweight loss in either case? If yes,then how much?
Correct Answer:
Verified
View Answer
Unlock this answer now
Get Access to more Verified Answers free of charge
Q200: The following figure shows the marginal revenue
Q201: The following figure shows the market demand
Q202: The following figure shows the market demand
Q203: The following figure shows the market demand
Q204: The following figure shows the market demand
Q206: The following figure shows the market demand
Q207: The following figure is a supply-demand diagram
Q208: The following figure shows the market demand
Q209: The following figure shows the demand (D),
Q210: The following figure is a supply-demand diagram
Unlock this Answer For Free Now!
View this answer and more for free by performing one of the following actions

Scan the QR code to install the App and get 2 free unlocks

Unlock quizzes for free by uploading documents