The following figure is a supply-demand diagram that characterizes the demand, marginal revenue, and cost curves for a profit-maximizing monopolist.
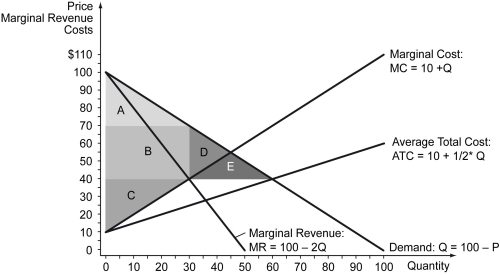
-Refer to the figure above.Under monopoly,consumer surplus is ________.
A) Area A
B) Areas A + B
C) Areas A+ B + C
D) Areas A + B + C + D + E
Correct Answer:
Verified
Q213: The following figure shows the market demand
Q214: The following figure is a supply-demand diagram
Q215: The following figure is a supply-demand diagram
Q216: The following figure shows the market demand
Q217: The following figure shows the demand curve
Q219: The following figure shows the market demand
Q220: The following figure shows the demand (D),
Q221: Scenario: Tobac Co. is a monopolist in
Q222: Suppose a cereal manufacturer offers one of
Q223: Economist Reuben Kessel wrote an influential article
Unlock this Answer For Free Now!
View this answer and more for free by performing one of the following actions

Scan the QR code to install the App and get 2 free unlocks

Unlock quizzes for free by uploading documents