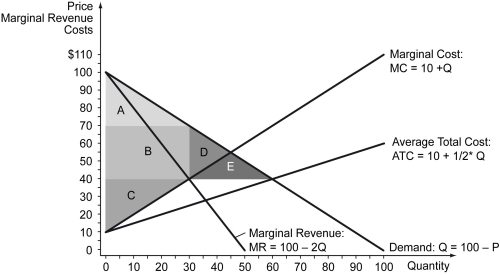
The following figure is a supply-demand diagram that characterizes the demand, marginal revenue, and cost curves for a profit-maximizing monopolist.

-Refer to the figure above.If the industry were perfectly competitive (marginal cost pricing) rather than a monopoly,social surplus would be ________.
A) Areas A + B + C + D + E
B) Areas A + B + C + D
C) Areas A + B + C
D) Areas A + C
Correct Answer:
Verified
Q210: The following figure is a supply-demand diagram
Q211: The following figure shows the market demand
Q212: The following figure shows the market demand
Q213: The following figure shows the market demand
Q214: The following figure is a supply-demand diagram
Q216: The following figure shows the market demand
Q217: The following figure shows the demand curve
Q218: The following figure is a supply-demand diagram
Q219: The following figure shows the market demand
Q220: The following figure shows the demand (D),
Unlock this Answer For Free Now!
View this answer and more for free by performing one of the following actions

Scan the QR code to install the App and get 2 free unlocks

Unlock quizzes for free by uploading documents