The following figure shows the costs and revenue curves of a firm in a monopoly market.
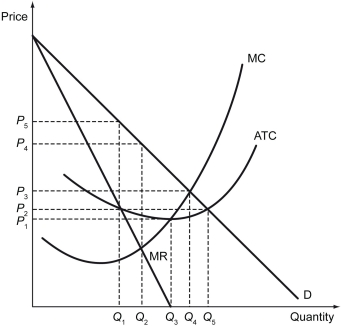
-Refer to the figure above.If this monopolist engages in the first-degree price discrimination,the consumer surplus in this market is equal to ________.
A) the area below the D curve, and above the P₂ level
B) the area below the D curve, and above the P₃ level
C) the area below the D curve, and above the P₄ level
D) zero
Correct Answer:
Verified
Q260: Peak-load pricing is when a firm charges
Q261: In the United States,the _ is a
Q262: If the government imposes marginal cost pricing
Q263: At a certain level of production,the average
Q264: Scenario: Tobac Co. is a monopolist in
Q266: The following figure shows the demand curve,
Q267: The following figure shows the demand curve,
Q268: A socially optimal price maximizes _.
A) consumer
Q269: Which of the following correctly identifies a
Q270: The following figure shows the demand curve,
Unlock this Answer For Free Now!
View this answer and more for free by performing one of the following actions

Scan the QR code to install the App and get 2 free unlocks

Unlock quizzes for free by uploading documents