The following figure shows the demand curve, the marginal revenue (MR) curve, the marginal cost (MC) curve, and the average total cost (ATC) curve of a monopolist.
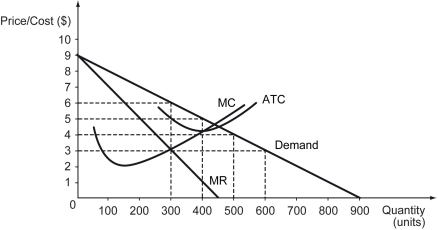
-Refer to the figure above.If the monopolist is forced by regulation to charge the fair-returns price for the profit-maximizing output it produces,________.
A) it makes a profit of $100
B) it makes a profit of $200
C) it incurs a loss of $100
D) it makes zero profit
Correct Answer:
Verified
Q261: In the United States,the _ is a
Q262: If the government imposes marginal cost pricing
Q263: At a certain level of production,the average
Q264: Scenario: Tobac Co. is a monopolist in
Q265: The following figure shows the costs and
Q267: The following figure shows the demand curve,
Q268: A socially optimal price maximizes _.
A) consumer
Q269: Which of the following correctly identifies a
Q270: The following figure shows the demand curve,
Q271: The socially optimal price is to set
Unlock this Answer For Free Now!
View this answer and more for free by performing one of the following actions

Scan the QR code to install the App and get 2 free unlocks

Unlock quizzes for free by uploading documents