The figure here shows the distribution of molecular speeds of a gas for two temperatures T1 and T2. The speed is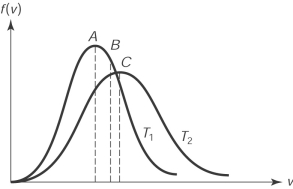
A) the rms speed of the molecules whose temperature is T1.
B) the rms speed of the molecules whose temperature is T2.
C) the average speed of the molecules whose temperature is T1.
D) the average speed of the molecules whose temperature is T2.
E) the most probable speed of the molecules whose temperature is T1.
Correct Answer:
Verified
Q34: An ideal gas is slowly expanding
Q35: If the rms speed in a particular
Q36: The equivalent of the root-mean-square speed for
Q37: There are 5.00
Q38: The figure here shows the distribution of
Q40: The molecules of a five-particle gas have
Q41: The molecules of a five-particle gas have
Q42: The molecules of a five-particle gas have
Q43: The mass of a deuterium (diatomic) molecule
Q44: The mass of a deuterium (diatomic) molecule
Unlock this Answer For Free Now!
View this answer and more for free by performing one of the following actions

Scan the QR code to install the App and get 2 free unlocks

Unlock quizzes for free by uploading documents