Figure 4-1
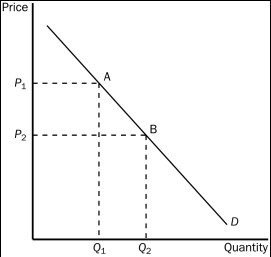
-Refer to Figure 4-1.The movement from point A to point B on the graph would be caused by
A) an increase in price.
B) a decrease in price.
C) a decrease in the price of a substitute good.
D) an increase in income.
Correct Answer:
Verified
Q62: The line that relates the price of
Q63: The line that relates the price of
Q64: If a decrease in income increases the
Q65: With respect to the variables price and
Q66: When constructing a demand curve,
A)demand is on
Q67: Which of the following changes would not
Q69: Which of the following would not affect
Q70: Figure 4-1 Q72: A table that shows the relationship between Q173: Figure 4-1
![]()
![]()
Unlock this Answer For Free Now!
View this answer and more for free by performing one of the following actions

Scan the QR code to install the App and get 2 free unlocks

Unlock quizzes for free by uploading documents