Figure 4-3
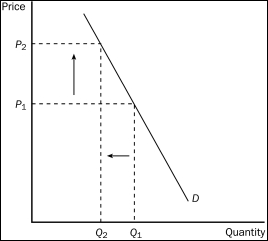
-Refer to Figure 4-3.The graph shows the demand for cigarettes.The arrows are consistent with which of the following events?
A) The price of marijuana, a complement to cigarettes, increased.
B) Mandatory health warnings were placed on cigarette packages.
C) Several foreign countries banned U.S.cigarettes in their countries.
D) A tax was placed on cigarettes.
Correct Answer:
Verified
Q100: The table shows individual demand schedules for
Q101: Figure 4-3 Q102: When quantity demanded has increased at every Q104: Today's demand curve for gasoline could shift Q104: Warrensburg is a small college town in Q107: The downward slope of the typical demand Q108: When quantity demanded decreases at every possible Q144: The belief that tobacco is a "gateway Q178: An increase in demand is represented by Q244: Most studies indicate that tobacco and marijuana
![]()
A)
Unlock this Answer For Free Now!
View this answer and more for free by performing one of the following actions

Scan the QR code to install the App and get 2 free unlocks

Unlock quizzes for free by uploading documents