Figure 4-3
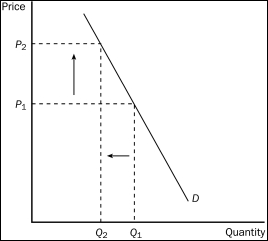
-Refer to Figure 4-3.The graph shows the demand for cigarettes.The arrows are consistent with which of the following events?
A) Tobacco and marijuana are complements and the price of marijuana decreased.
B) Tobacco is a "gateway drug" and the price of marijuana increased.
C) The price of cigarettes increased.
D) The arrows are consistent with all of these events.
Correct Answer:
Verified
Q96: The table shows individual demand schedules for
Q97: The sum of all individual demand curves
Q100: The table shows individual demand schedules for
Q102: When quantity demanded has increased at every
Unlock this Answer For Free Now!
View this answer and more for free by performing one of the following actions

Scan the QR code to install the App and get 2 free unlocks

Unlock quizzes for free by uploading documents