Figure 6-11. On the graph below, the shift of the supply curve from S₁ to S₂ represents the imposition of a tax on a good. On the axes, Q represents the quantity of the good and P represents the price.
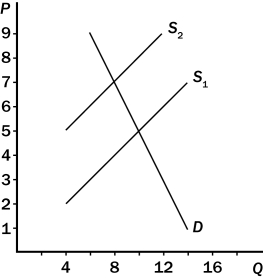
-Consider Figure 6-11.Before the tax is imposed,
A) buyers pay $5 per unit.
B) sellers receive $5 per unit.
C) total revenue for sellers amounts to $50.
D) All of the above are correct.
Correct Answer:
Verified
Q138: Figure 6-8 Q139: When a tax is imposed on tea Q140: If buyers are required to pay a Q141: Suppose a tax is imposed on the Q142: When a tax is placed on the Q144: When a tax is placed on the Q145: Figure 6-10 Q146: Which is the most correct statement about Q147: Q148: Figure 6-10 Unlock this Answer For Free Now! View this answer and more for free by performing one of the following actions Scan the QR code to install the App and get 2 free unlocks Unlock quizzes for free by uploading documents
![]()
![]()
Figure 6-11. On the graph below, the
![]()

