Multiple Choice
Figure 6-11. On the graph below, the shift of the supply curve from S₁ to S₂ represents the imposition of a tax on a good. On the axes, Q represents the quantity of the good and P represents the price.
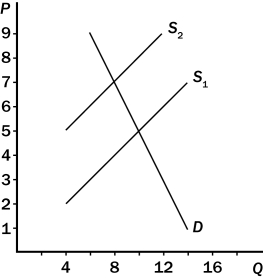
-Consider Figure 6-11.The amount of the tax per unit is
A) $1.50.
B) $2.00.
C) $2.50.
D) $3.00.
Correct Answer:
Verified
Related Questions
Q142: When a tax is placed on the
Q143:
Figure 6-11. On the graph below, the
Q144: When a tax is placed on the

