Figure 6-11. On the graph below, the shift of the supply curve from S₁ to S₂ represents the imposition of a tax on a good. On the axes, Q represents the quantity of the good and P represents the price.
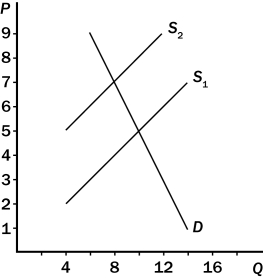
-Consider Figure 6-11.From the appearance of the graph,it is apparent that,for every unit of the good that is sold,
A) sellers are required to send one dollar to the government and buyers are required to send two dollars to the government.
B) sellers are required to send two dollars to the government and buyers are required to send one dollar to the government.
C) sellers are required to send three dollars to the government and buyers are required to send nothing to the government.
D) sellers are required to send nothing to the government and buyers are required to send two dollars to the government.
Correct Answer:
Verified
Q147:
Figure 6-11. On the graph below, the
Q148: Figure 6-10 Q149: Figure 6-10 Q150: A tax imposed on the sellers of Q151: The initial impact of a tax on Q153: If a tax is levied on the Q154: When a tax is placed on the Q155: A tax imposed on the sellers of Q156: Figure 6-10 Q157: Figure 6-10 Unlock this Answer For Free Now! View this answer and more for free by performing one of the following actions Scan the QR code to install the App and get 2 free unlocks Unlock quizzes for free by uploading documents
![]()
![]()
![]()
![]()

