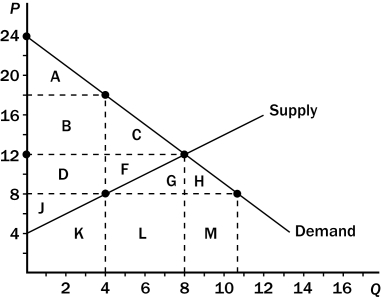
Figure 8-7 The graph below represents a $10 per unit tax on a good. On the graph, Q represents quantity and P represents price.

-Refer to Figure 8-7.The deadweight loss of the tax is represented by the area
A) B + D.
B) C + F.
C) A + C + F + J.
D) B + C + D + F.
Correct Answer:
Verified
Q8: Suppose a tax of $1 per unit
Q26: Suppose that policymakers are considering placing a
Q34: Which of the following statements is correct
Q49: Economists disagree on whether labor taxes cause
Q152: Quantitatively,which of the following taxes are the
Q154: Scenario 8-1
Ryan would be willing to pay
Q156: The amount of deadweight loss that results
Q159: Scenario 8-2
Tom mows Stephanie's lawn for $25.
Q160: Figure 8-7 The graph below represents a
Q181: Assume the price of gasoline is $2.00
Unlock this Answer For Free Now!
View this answer and more for free by performing one of the following actions

Scan the QR code to install the App and get 2 free unlocks

Unlock quizzes for free by uploading documents