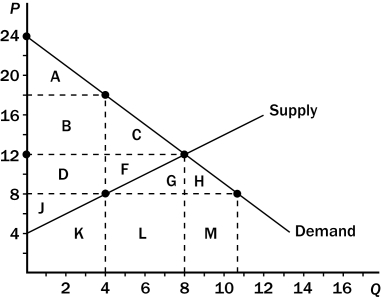
Figure 8-7 The graph below represents a $10 per unit tax on a good. On the graph, Q represents quantity and P represents price.

-Refer to Figure 8-7.One effect of the tax is to
A) reduce consumer surplus from $60 to $24.
B) reduce producer surplus from $32 to $8.
C) create a deadweight loss of $24.
D) All of the above are correct.
Correct Answer:
Verified
Q8: Suppose a tax of $1 per unit
Q26: Suppose that policymakers are considering placing a
Q48: If the labor supply curve is nearly
Q49: Economists disagree on whether labor taxes cause
Q156: The amount of deadweight loss that results
Q157: Figure 8-7 The graph below represents a
Q159: Scenario 8-2
Tom mows Stephanie's lawn for $25.
Q163: Economists generally agree that the most important
Q181: Assume the price of gasoline is $2.00
Q332: Henry George argued that the government should
Unlock this Answer For Free Now!
View this answer and more for free by performing one of the following actions

Scan the QR code to install the App and get 2 free unlocks

Unlock quizzes for free by uploading documents