Figure 9-15. The figure below illustrates a tariff. On the graph, Q represents quantity and P represents price.
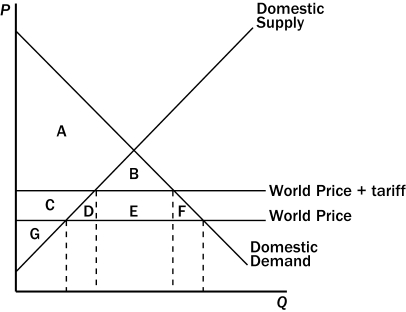
-Refer to Figure 9-15.The tariff
A) decreases producer surplus by the area C and decreases consumer surplus by the area C + D + E + F.
B) decreases producer surplus by the area C + D and decreases consumer surplus by the area D + E + F.
C) increases producer surplus by the area C and decreases consumer surplus by the area C + D + E + F.
D) increases producer surplus by the area B + C and decrease consumer surplus by the area D + E + F.
Correct Answer:
Verified
Q149: A tariff on a product
A)enhances the economic
Q158: Denmark is an importer of computer chips,taking
Q159: Figure 9-12 Q161: Figure 9-14 Q162: Figure 9-14 Q164: Figure 9-15. The figure below illustrates a Q165: Figure 9-14 Q166: Figure 9-14 Q167: Figure 9-15. The figure below illustrates a Q168: Figure 9-14 Unlock this Answer For Free Now! View this answer and more for free by performing one of the following actions Scan the QR code to install the App and get 2 free unlocks Unlock quizzes for free by uploading documents
![]()
![]()
![]()
![]()
![]()
![]()

