Figure 15-3
The figure below illustrates the cost and revenue structure for a monopoly firm.
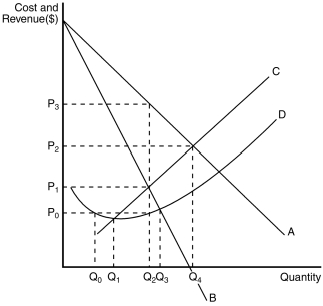
-Refer to Figure 15-3.A profit-maximizing monopoly's total revenue is equal to
A) P₃ × Q₂.
B) P₂ × Q₄.
C) (P₃ - P₀) × Q₂.
D) (P₃ - P₀) × Q₄.
Correct Answer:
Verified
Q82: Figure 15-2
The figure below illustrates the cost
Q85: Figure 15-3
The figure below illustrates the cost
Q86: When a pharmaceutical company discovers a new
Q87: Competitive firms differ from monopolies in which
Q88: Figure 15-2
The figure below illustrates the cost
Q89: Figure 15-3
The figure below illustrates the cost
Q137: Which of the following statements is true
Q313: As a monopolist increases the quantity of
Q387: Table 15-1 Q396: Table 15-1 ![]()
![]()
Unlock this Answer For Free Now!
View this answer and more for free by performing one of the following actions

Scan the QR code to install the App and get 2 free unlocks

Unlock quizzes for free by uploading documents