Figure 15-3
The figure below illustrates the cost and revenue structure for a monopoly firm.
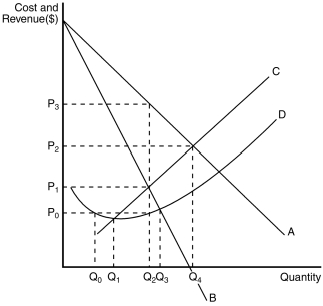
-Refer to Figure 15-3.A profit-maximizing monopoly's total cost is equal to
A) (P₁ - P₀) × Q₂.
B) P₀ × Q₁.
C) P₀ × Q₂.
D) P₀ × Q₃.
Correct Answer:
Verified
Q84: Figure 15-3
The figure below illustrates the cost
Q85: Figure 15-3
The figure below illustrates the cost
Q86: When a pharmaceutical company discovers a new
Q87: Competitive firms differ from monopolies in which
Q88: Figure 15-2
The figure below illustrates the cost
Q91: Figure 15-2
The figure below illustrates the cost
Q92: What happens to the price and quantity
Q93: Figure 15-3
The figure below illustrates the cost
Q94: Figure 15-2
The figure below illustrates the cost
Q489: Generic drugs enter the pharmaceutical drug market
Unlock this Answer For Free Now!
View this answer and more for free by performing one of the following actions

Scan the QR code to install the App and get 2 free unlocks

Unlock quizzes for free by uploading documents