Figure 15-3
The figure below illustrates the cost and revenue structure for a monopoly firm.
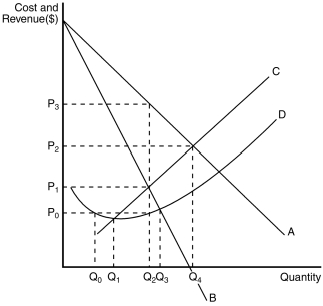
-Refer to Figure 15-3.At the profit-maximizing level of output,
A) marginal revenue is equal to P₃.
B) marginal cost is equal to P₃.
C) average revenue is equal to P₃.
D) average total cost is equal to P₁.
Correct Answer:
Verified
Q88: Figure 15-2
The figure below illustrates the cost
Q89: Figure 15-3
The figure below illustrates the cost
Q91: Figure 15-2
The figure below illustrates the cost
Q92: What happens to the price and quantity
Q94: Figure 15-2
The figure below illustrates the cost
Q97: Figure 15-2
The figure below illustrates the cost
Q307: In a market characterized by monopoly, the
Q481: In a competitive market, a firm's supply
Q489: Generic drugs enter the pharmaceutical drug market
Q491: Due to the nature of the patent
Unlock this Answer For Free Now!
View this answer and more for free by performing one of the following actions

Scan the QR code to install the App and get 2 free unlocks

Unlock quizzes for free by uploading documents