Following is a chart of the correlation between the returns of stock C and stock D. 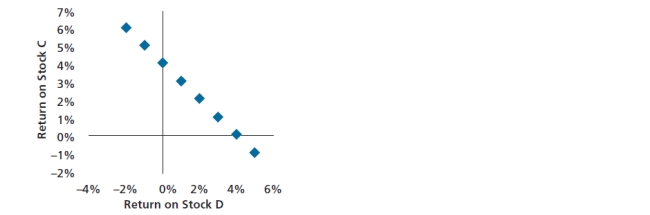 The correlation between the two returns is best described as:
A) no correlation.
B) positive correlation.
C) negative correlation.
D) perfect negative correlation.
Correct Answer:
Verified
Q20: Which of the following statements is incorrect?
A)
Q21: A statistical measure of the degree to
Q22: Which of the following is not a
Q23: Which of the following statements is true?
A)
Q24: Which of the following statements is false?
A)
Q26: Following is a chart of the correlation
Q27: Stock returns are typically:
A) positively correlated with
Q28: Diversification is most effective when the returns
Q29: Using the given correlation matrix, which of
Q30: Using the given correlation matrix of these
Unlock this Answer For Free Now!
View this answer and more for free by performing one of the following actions

Scan the QR code to install the App and get 2 free unlocks

Unlock quizzes for free by uploading documents