Figure 18-3
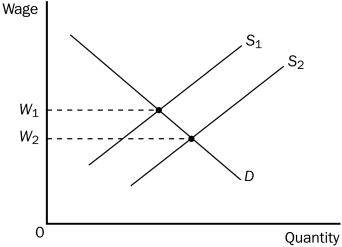
-Refer to Figure 18-3.The shift of the labor supply curve from S₁ to S₂ could possibly be explained by
A) technological progress.
B) a change in the price of firms' output.
C) a change in workers' attitudes toward the work-leisure tradeoff.
D) All of the above are correct.
Correct Answer:
Verified
Q93: The accumulation of machinery and buildings used
Q96: The purchase price of capital is
A)the value
Q112: Figure 18-2 Q175: Consider the market for university economics professors.Because Q176: Figure 18-2 Q177: Consider the market for university economics professors.Consider Q179: Scenario 18-4 Unlock this Answer For Free Now! View this answer and more for free by performing one of the following actions Scan the QR code to install the App and get 2 free unlocks Unlock quizzes for free by uploading documents
![]()
![]()
Rocchetta Industries manufactures and supplies bottled

