Multiple Choice
Figure 18-3
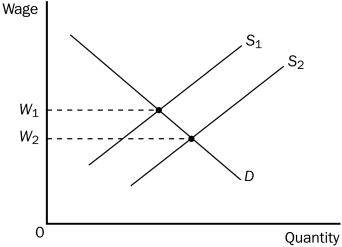
-Refer to Figure 18-3.Assume W₁ = $20 and W₂ = $18 and the market is always in equilibrium.Then the shift of the labor supply curve from S₁ to S₂
A) increases the value of the marginal product of labor by $2.
B) decreases the value of the marginal product of labor by $2.
C) decreases the value of the marginal product of labor by more than $2.
D) does not change the value of the marginal product of labor.
Correct Answer:
Verified
Related Questions
Q93: The accumulation of machinery and buildings used
Q96: The purchase price of capital is
A)the value

