Construct a bar graph of the given frequency distribution:
-The frequency distribution indicates the number of fish caught by each fisherman in a group of 250 fishermen. 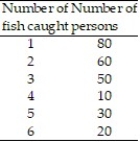
A) 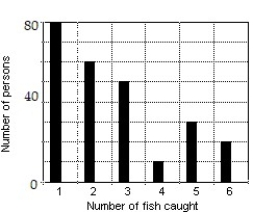
B) 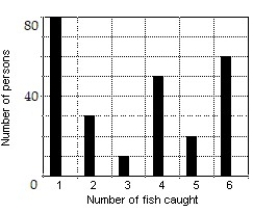
C) 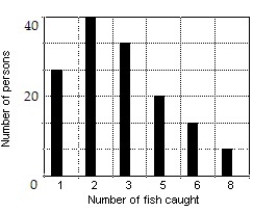
D) 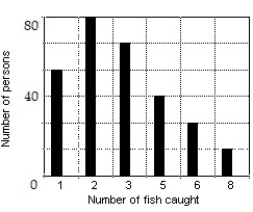
Correct Answer:
Verified
Q5: Construct the specified histogram:
-Eighty U. S households
Q6: Construct the specified histogram:
-Construct a histogram for
Q7: Construct the specified histogram:
-Twenty voters were asked
Q8: Construct the specified histogram:
-Construct a histogram for
Q9: Construct a bar graph of the given
Q11: Construct a broken-line graph of the data
Q12: Construct a broken-line graph of the data
Q13: Construct a pie graph, with sectors given
Q14: Construct a pie graph, with sectors given
Q15: Construct a pie graph, with sectors given
Unlock this Answer For Free Now!
View this answer and more for free by performing one of the following actions

Scan the QR code to install the App and get 2 free unlocks

Unlock quizzes for free by uploading documents