Construct a broken-line graph of the data in the table:
-The following table gives the total amount of precipitation during the given months. Use time on the horizontal scale for your line graph. 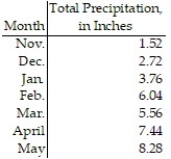
Correct Answer:
Verified
View Answer
Unlock this answer now
Get Access to more Verified Answers free of charge
Q7: Construct the specified histogram:
-Twenty voters were asked
Q8: Construct the specified histogram:
-Construct a histogram for
Q9: Construct a bar graph of the given
Q10: Construct a bar graph of the given
Q11: Construct a broken-line graph of the data
Q13: Construct a pie graph, with sectors given
Q14: Construct a pie graph, with sectors given
Q15: Construct a pie graph, with sectors given
Q16: Construct a frequency polygon: Q17: Construct a frequency polygon:
-![]()
-![]()
Unlock this Answer For Free Now!
View this answer and more for free by performing one of the following actions

Scan the QR code to install the App and get 2 free unlocks

Unlock quizzes for free by uploading documents