Suppose that an increase in oil prices causes the supply curve of gasoline to shift. Using a graph, illustrate the resulting changes in equilibrium price and quantity in both the short run and the long run. 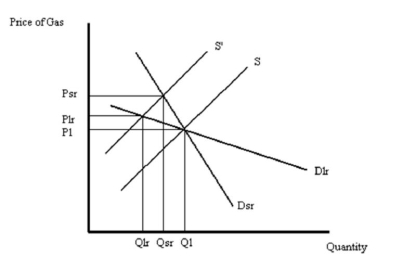
Correct Answer:
Verified
View Answer
Unlock this answer now
Get Access to more Verified Answers free of charge
Q1: Q2: Refer to carefully-labeled diagrams to explain each Q3: Using a carefully-labeled graph, explain the concept Q4: Harriet enjoys watching both American Idol and Q5: Suppose that you can schedule a worker Q6: Suppose the demand function for cable TV Q7: Consider the relationship given by QCars = Q8: If the demand for a good increases Q9: What is the difference between a change Q10: Using a graph, explain how an increase![]()
Unlock this Answer For Free Now!
View this answer and more for free by performing one of the following actions

Scan the QR code to install the App and get 2 free unlocks

Unlock quizzes for free by uploading documents