Sample means and ranges were obtained for five samples of 10 units per sample from a production process. Assume the process was considered to be in control during the period these samples were collected. The results are as follows:
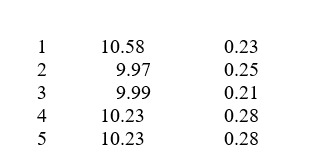
-What is the central line of the R chart for this process?
A) 0.23
B) 0.19
C) 0.44
D) 0.25
E) 0.06
Correct Answer:
Verified
Q5: A drive-in restaurant is running a new
Q6: A drive-in restaurant is running a new
Q7: Sample means and ranges were obtained for
Q8: Sample means and ranges were obtained for
Q9: Sample means and ranges were obtained for
Q11: Sample means and ranges were obtained for
Q12: Sample means and ranges were obtained for
Q13: Fifteen samples of size 10 are taken
Q14: Fifteen samples of size 10 are taken
Q15: Fifteen samples of size 10 are taken
Unlock this Answer For Free Now!
View this answer and more for free by performing one of the following actions

Scan the QR code to install the App and get 2 free unlocks

Unlock quizzes for free by uploading documents