Fifteen samples of size 10 are taken from a stable process. The average of the sample means is 32.8, and the average range of the samples is 1.5. Use the information contained in the chart below (Table 13s.1) :
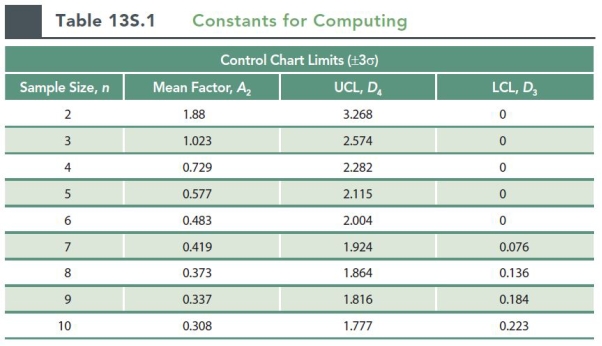
-The UCL for the three sigma R chart for the process is approximately (for a sample size of 10, D3 = 1.777, D4 = 0.223) :
A) 0.39
B) 0.34
C) 0.46
D) 2.67
E) 1.50
Correct Answer:
Verified
Q10: Sample means and ranges were obtained for
Q11: Sample means and ranges were obtained for
Q12: Sample means and ranges were obtained for
Q13: Fifteen samples of size 10 are taken
Q14: Fifteen samples of size 10 are taken
Q16: Fifteen samples of size 10 are taken
Q17: Use the information contained in this chart
Q18: Use the information contained in this chart
Q19: Use the information contained in this chart
Q20: Use the information contained in this chart
Unlock this Answer For Free Now!
View this answer and more for free by performing one of the following actions

Scan the QR code to install the App and get 2 free unlocks

Unlock quizzes for free by uploading documents