Use the information contained in this chart to determine your answer. Twenty samples of size 8 were taken from a stable process. From past studies of the process, you know that the overall mean is 42.5 and that the average of the samples range is 2.0.
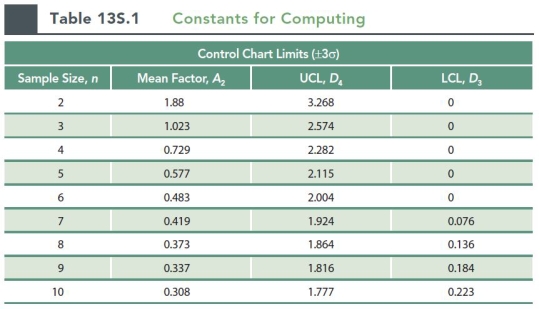
-The LCL for the three sigma X bar chart for the process is approximately (for a sample size of 8, A2 = 0.373) :
A) 42.95
B) 43.25
C) 43.46
D) 42.50
E) 41.75
Correct Answer:
Verified
Q13: Fifteen samples of size 10 are taken
Q14: Fifteen samples of size 10 are taken
Q15: Fifteen samples of size 10 are taken
Q16: Fifteen samples of size 10 are taken
Q17: Use the information contained in this chart
Q19: Use the information contained in this chart
Q20: Use the information contained in this chart
Q21: A pizza delivery service wants to track
Q22: A pizza delivery service wants to track
Q23: An airline wants to monitor the performance
Unlock this Answer For Free Now!
View this answer and more for free by performing one of the following actions

Scan the QR code to install the App and get 2 free unlocks

Unlock quizzes for free by uploading documents