The following diagram shows the demand for and supply of apples. The supply and demand curves are initially given by S0 and D0. The market is in equilibrium at point x. There is then a rise in the price of pears and oranges and an increase in the costs of transporting fresh fruit. As a result either or both the demand and supply curves shift to one of the new positions shown in the diagram. What will be the equilibrium position on the diagram? 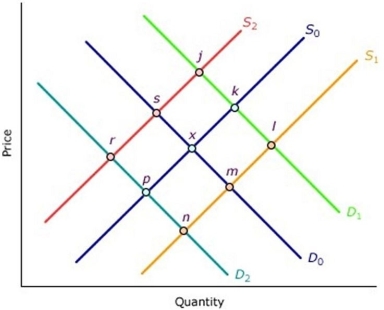
A) Point l
B) Point r
C) Point j
D) Point n
Correct Answer:
Verified
Q30: If the market price is below equilibrium,
Q31: When excess demand occurs in a free
Q32: When excess supply occurs in a free
Q33: In a free market, if there is
Q34: The following diagram shows the demand for
Q36: If house prices rise faster than other
Q37: House prices have increased more quickly than
Q38: Which of the following are determinants of
Q39: If interest rates rise, what will happen
Q40: Consider the market for new flats. What
Unlock this Answer For Free Now!
View this answer and more for free by performing one of the following actions

Scan the QR code to install the App and get 2 free unlocks

Unlock quizzes for free by uploading documents