Multiple Choice
Figure 10-18
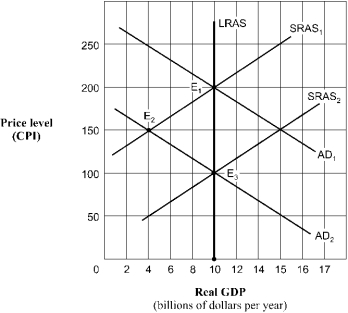
-Beginning in Figure 10-18 from long-run equilibrium at point E₁,the aggregate demand curve shifts to AD₂.The economy's path to a new long-run equilibrium is represented by a movement from
A) E₃ to E₁ to E₂.
B) E₁ to E₃ to E₂.
C) E₂ to E₁ to E₂.
D) E₁ to E₂ to E₃.
Correct Answer:
Verified
Related Questions

