Use the figure below to answer the following question(s) .
Figure 10-15 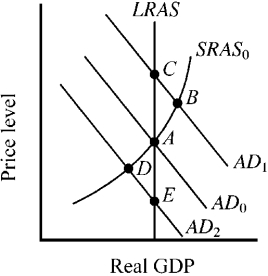
-The economy's short-run (SRAS ) and long-run (LRAS) aggregate supply curves are shown in Figure 10-15, along with three alternative aggregate demand curves and the accompanying equilibrium points. At which point will resource prices naturally tend to decrease?
A) A
B) B
C) C
D) D
Correct Answer:
Verified
Q141: Use the figure below to answer the
Q142: Use the figure below to answer the
Q143: Use the figure below to answer the
Q144: Use the figure below to answer the
Q145: Use the figure below to answer the
Q147: Use the figure below to answer the
Q148: Figure 10-13 Q149: Use the figure below to answer the Q150: Use the figure below to answer the Q151: Figure 10-12 ![]()
![]()
Unlock this Answer For Free Now!
View this answer and more for free by performing one of the following actions

Scan the QR code to install the App and get 2 free unlocks

Unlock quizzes for free by uploading documents