Use the figure below to answer the following question(s) .
Figure 10-15 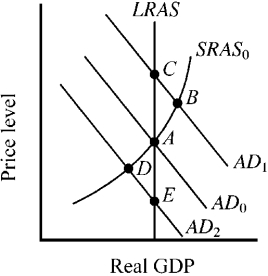
-The economy's short-run (SRAS ) and long-run (LRAS) aggregate supply curves are shown in Figure 10-15, along with three alternative aggregate demand curves and the accompanying equilibrium points. At which point will resource prices naturally tend to increase?
A) A
B) B
C) C
D) D
Correct Answer:
Verified
Q70: Which of the following contributed to the
Q72: The economic boom between 2002 and 2006
Q138: Use the figure below to answer the
Q139: Use the figure below to answer the
Q141: Use the figure below to answer the
Q143: Use the figure below to answer the
Q144: Use the figure below to answer the
Q145: Use the figure below to answer the
Q146: Use the figure below to answer the
Q147: Use the figure below to answer the
Unlock this Answer For Free Now!
View this answer and more for free by performing one of the following actions

Scan the QR code to install the App and get 2 free unlocks

Unlock quizzes for free by uploading documents